
PUBLIC EXPENDITURE IN INDIA: TRENDS ANALYSIS USING TIME SERIES

1. Introduction to Public Expenditure
Public expenditure is expenditure by the government on various government activities and social sector services. Public expenditure is necessary for supporting the economy and economic activities. The purpose of public expenditure is not limited to providing essential goods and services but also it provides employment and liberal rights to use to its population. In this article, you will get trends in public expenditure in India and also theories and causes of public expenditure.
In almost every type of economy, whether it is socialist, capitalist or mixed, government participates in various economic activities directly and indirectly. Also, the government is responsible for establishing the welfare state in a country. This results in huge expenditure or investment by the government. Developing countries are generally characterized by lower socio-economic indicators, and widespread poverty & inequality. Thus, developing countries require a higher level of public expenditure to accelerate its economic growth social indicator.
The Indian economy is a mixed type of economy where there is the participation of both public and private sector in economic activities. It is also a developing economy and needs huge public expenditure in social and infrastructure sector. The tax to GDP ratio in India is very low and the government is not able to provide sufficient fund for various public works. The major components of public expenditure in India are interest payments, defence, pensions, salaries and subsidies collectively account for more than 60 per cent of total public expenditure.
The increasing need for public expenditure and insufficient fund with the government raises the need for better utilization of public expenditure and efficient management of fiscal deficit. The government has taken several initiatives to improve efficiency and utilization of defence expenditure, encouraging private sector participation in this sector and promoting self-reliance. For the purpose of managing the fiscal deficit, the government implemented Fiscal Responsibility and Budgetary Management (FRBM) Act 2003, which aims to maintain the fiscal deficit at 3 per cent.
The following pie chart shows the composition of public expenditure in India in 2018-19. It can be seen that interest payment has the highest share of about one-fourth of the total public expenditure in India.
Figure: 1. Composition of Public Expenditure in India in 2018-19 RE
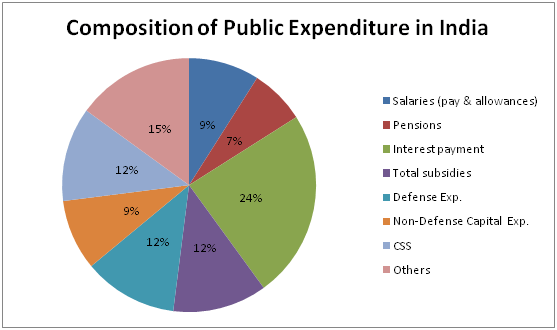
Source: Union Budget Documents, RE: Revised Estimates (as per Interim Budget)
2. Classification of Public Expenditure
Article 112 of the constitution of India mandates that the government has to prepare an estimate of all past and prospective expenditure in the form of a budget document and present it in front of parliament for approval. This document classifies different types of expenditure under different categories. Following are the categories of public expenditure.
- Development and Non-Development Expenditure
Total expenditure can be divided into development and non-development expenditure. Development expenditure consists of all the productive expenditure by the government that can further lead to social welfare and accelerate economic growth and development. These expenditures are like a productive investment and used in the production of capital goods and services which provide instant benefits as well as it has some future prospective benefits. These expenditures include spending on various economic services and social services.
Non-Development expenditures are like consumption expenditure and provide instant benefit and expand the well-being of the society, but it doesn’t lead to further economic growth or development. These expenditures include expenditure on subsidies, defence expenditure, salaries, pensions etc.
This classification of public expenditure is not used in fiscal management in India. As per the recommendation of Sukhomoy Chakravarti Committee in the year 1987-88, development and non-development expenditure were replaced by plan and non-plan expenditure.
- Plan and Non-Plan Expenditure
The Plan expenditure consists of all the expenditures that are part of central planning. Plan expenditure includes all products and assets creating expenditure.
Non-Plan expenditure consists of all the expenditures that are incurred on completed or previous schemes interest payment on borrowings. It often includes non-asset building and consumption expenditure.
In September 2011, a panel headed by Dr C Rangarajan suggested redefining the plan and non-plan expenditure as capital and revenue expenditure.
- Capital and Revenue Expenditure
Capital expenditures are expenditure on building fixed assets and are non-recurring in nature. This expenditure focuses on improving economic and social activities and productivity of the economy. These expenditures include loans to state and foreign governments and public enterprises to finance the project and capital defence expenditure.
Revenue expenditures are recurring kind of expenditure incurred year by year on current consumption. These expenditures include salaries, pension, subsidies etc.
3. Approaches to Theories of Public Expenditure
The theories of public expenditure explain the various aspects of public expenditure and the factors determining public expenditure. Followings are some important theories or approaches of public expenditure.
- Marginal Utility Approach
Marginal Utility Approach is a set of theories developed in the 1920s, which generally states that the marginal benefit of different types of public expenditure on various items should meet the marginal cost or disadvantages of the various methods are used to raise the fund for this public expenditure.
- Public Good Approach
The public good approach argues that there are some goods and services that cannot be provided by the private mechanism or, these goods and services are consumed by the large population but not everyone has the ability of pay for these goods and services. Thus, the government has to be responsible to provide these public goods and lead to huge public expenditure.
- Public Choice Approach
The Public Choice Approach refers to the political approach to public expenditure. According to this approach, the government fulfil the choice of its major voters and makes expenditure on such goods and services that secure its vote and chance to win the election again. It refutes the view that government makes a public expenditure for the welfare to its natives.
- Positive Approaches
The positive approaches consist of theories that seek to explain the growth of public expenditure over time. Followings are two important theories of public expenditure under this approach.
- Wagner’s Law
Adolph Wagner in 1876 propounded “Law of increasing state activities” which explains that the public expenditure increases over time as the economy grows. The law explains that as the economy grows and decentralization takes place in administration and governance structure, which leads to the continuous increase in expenditure on law and order, urbanization and welfare to its population. Thus, the state activities increase over time and with the further growth of the economy.
- Peacock Wiseman Hypothesis
The Peacock Wiseman Hypothesis is based on the idea of a discontinuous increase in public expenditure. The hypothesis basically talks about three types of effects in the growth of public expenditure. The first effect is called displacement effect i.e. due to some desirable or undesirable reason the level of public expenditure and taxation increase to a new level with displacing the old level. The second effect is the inspection effect refers to the situation where people demand to inspect the upheaval and improve it from the government. It results in a further increase in public expenditure and the new tolerable level of taxation remains and doesn’t return to the old level. The third effect is called concentration-effect refers to the higher growth of central government activities than local or state government.
4. Trends in Public Expenditure in India
- Trends in Total Public Expenditure
Socialism is in the preamble to the constitution of India. After independence the Indian government is continuously working to establish a welfare state. The study found an increasing trend in total expenditure of the both state and Indian government in absolute terms in India. The following figure shows the trends in public expenditure in India.
Figure: 2. Trends in Public Expenditure in India from 1981 to 2019

Source: Budget Documents of State and Central governments of India
The two trends lines show the trends for state and central governments. It can be seen that since the last decade the public expenditure has grown significantly and started to rise upward. During this decade the public expenditure has been growing very fast and moving toward the vertical shape.
The public expenditure of state was 25.17 thousand crores in 1981-82 and increased to 28.74 thousand crores in 1982-83 with a growth rate of 14.19 per cent and after showing fluctuation it reached to 159.15 thousand crores with a growth rate of 18.90 per cent in 1994-95. It was 514.30 thousand crores in 2003-04 with the highest growth rate of 25.36 per cent. However, in 2005-06, it was 561.68 thousand crores with the lowest growth rate of 1.49 per cent. The total public expenditure in 2018-19 was 3559.73 thousand crores with a growth rate of 12.03 per cent. The total state public expenditure has increased with a CAGR of 13.92 per cent from 1981-82 to 2018-19.
The public expenditure of the central government of India was 25.27 thousand crores in 1981-82 which increased to 279.34 thousand crores in 1998-99 with a growth rate of 20.38 per cent. It can be observed that there has been a wide fluctuation in the growth rate of the total central public expenditure. It was 2457.24 thousand crores in 2018-19 with a growth rate of 14.72 per cent. However, it was increased with a CAGR of 12.80 per cent between 1981-82 and 2018-19. The ratio of total public expenditure to GDP in 1981-82 was 14.37 per cent which has increased in the 1980s then started to decline. Excepting some years it was around 13 to 14 per cent of GDP. In the year 2018-19, the public expenditure was 12.93 per cent of GDP.
- Trends in Developmental and Non-Developmental Expenditure
Trends in development and non-development expenditure of state and central government are similar to trends in total public expenditure. In 1990-91, the development expenditure was 63.37 thousand crores for state and 58.65 thousand crores for the central government, while the non-development expenditure was 22.60 thousand crores for state and 49.35 thousand crores for the central government.
Figure: 3.Trends in Development and Non-Development Expenditure by State and Central Governmentfrom 1990-91 to 2018-19

Source: Ibid.
Figure: 4. Trends in Non-Development expenditure by state and central government from 1990-91 to 2018-19

Source: Ibid.
The development expenditure has increased over time and in 2000-01, it reached to 205.67 thousand crores for state, and 139.39 crores for the central government. While the non-development expenditure for state and central government were 116.82 and 197.42 thousand crores respectively in 2000-01.
Finally, in 2018-19, the development expenditure for state and central government were 2290.51 and 1146.83 thousand crore respectively, While in 2018-19, the non-development expenditure was 986.37 and 1295.39 thousand crore respectively. The CAGR of development and non-development expenditure for state and central government were 13.17 per cent & 10.80 per cent and 13.91 per cent & 11.93 per cent respectively from 1990-91 to 2018-19. The growth rate of development and non-development expenditure for both state and central government has been very fluctuating over time.
Table: 1. Development and Non-Development Expenditures of State and Central Government (at current price)

Source: National Statistical Office (NSO), Budget Documents of State and Central governments of India
However, it can be seen that the portion of the development and non-development expenditure in GDP has decreased over time. Development expenditure was 10 per cent of GDP in the year 1990-91 which decreased to 6.03 per cent in the year 2018-19. The non-development expenditure which was 8.42 per cent of GDP in the year 1990-91 increased to 9.07 per cent after one decade in the year 2000-01 and then it started to decrease and reached to 6.81 per cent of GDP in the year 2018-19.
The ratio of development to non-development expenditure has also decreased from 1990-91 to 2018-19 for both the government. The ratio of development to non-development expenditure for the state was 2.80 which started to decrease in the 1990s to late 2000s and again started to increase and reached at 2.32 in the year 2018-19. In the case of the central government, the ratio was 1.19 in the year 1990-91 and then started to decline till the year 2007-08 and then increased till 2012-13 and again decreased and reached at 0.89 in the year 2018-19.
- Trends in Revenue and Capital Expenditure
Revenue and capital expenditure for both state and central government have increased over time. In 1981-82, the revenue expenditure was 17.08 and 15.41 thousand crore for state and central government respectively, while the capital expenditure was 8.10 and 9.86 thousand crore for state and central government respectively.
Figure: 5. Trends in Revenue Expenditure of State and Central Government in India from 1981-82 to 2018-19

Source: Budget Documents of State and Central governments of India
Figure: 6. Trends in Capital Expenditure of State and Capital Government in India from 1981-82 to 2018-19

Source: Budget Documents of State and Central governments of India
The revenue expenditure for state and central government has increased to 86.19 and 82.19 thousand crore in 1991-92, while the capital expenditure has increased to 21.74 and 29.12 thousand crore respectively. Finally, in 2018-19, the revenue expenditure reached to 2783.78 thousand crores and 2140.61 thousand crores and capital expenditure reached to 775.95 thousand crores and 316.62 thousand crores for state and central government respectively.
The growth rate of revenue expenditure for both state and central government has decreased over time; while there can be seen wide volatility in the growth rate of capital expenditure for both state and central government. The overall growth rate of capital expenditure of state has increased in 2018-19 in comparison to 1981-82, but however, its trends in growth rate for central government cannot be stated as it has high volatility.
The following diagram presents the decadal figure of the capital and revenue expenditure.
Table: 2. Revenue and Capital Expenditure of State and Central Government in India (at Current Price)

Source: National Statistical Office (NSO), Budget Documents of State and Central governments of India
The revenue expenditure has always been more share in total expenditure compare to capital expenditure for both the state and central government. Revenue expenditure for the central government has increased very fast compare to state government.
It can also be noted that the revenue expenditure as a percentage of GDP for the central government has increased over time. It was 8.76 per cent of GDP in the year 1981-82 and after two decades in the year 2011-12 it was 13.12 per cent but in the year 2018-19, it decreased to 11.26 per cent of GDP. In the case of capital expenditure, its ratio to GDP has decreased over time. It was 5.61 per cent in the year 1981-82 and after one decade decreased to 4.32 per cent and finally in the year 2018-19, it decreased to 1.67 per cent of GDP.
5. Causes of Growth of Public Expenditure in India
The increasing trends in public expenditure in India are due to various factors. Followings are the some important reasons that resulted in increase in public expenditure in India.
- Population
The increase in population is one of the major causes of the growth of public expenditure in India. Increasing population requires more and more social sectors expenditure, public goods and strong law and order. The population of India was 692 million in 1981-82 which increased to 1,040 million in 2001-02 and further it increased and reached to 1332 million in 2018-19.
- Increase in per-capita income
According to Musgrave increase in per-capita income leads to an increase in demand for public goods. Thus, it leads to an increase in public expenditure. The per-capita income in India was 2,115 rupees per annum which increased to 1,41,265 rupees per annum.
- Defense Expenditure
Defence expenditure in India has increased significantly. It possesses a major portion in both revenue and capital expenditure. Although, its share in revenue expenditure has decreased over time its share in capital expenditure gas increased very rapidly. It possesses almost one-third of total capital expenditure. According to the union budget document, 12 per cent of total public expenditure in India goes to defence expenditure in 2018-19.
- Subsidy
The subsidy is necessary to support essential economic activities like agriculture. The share of subsidies in total expenditure has increased over time by showing the decreasing sign. It was 8.90 per cent of total public expenditure in 1981-82 which increased to 18.22 per cent in 2012-13 and in 2018-19 it was 12.22 per cent of total public expenditure in India.
- Interest payments
Interest payments have been increased over time contributes significantly to raising public expenditure in India. In 1981-82, the share of interest payments in total expenditure was 11.44 per cent which increased very rapidly during the 1990s and 2000s and reached to 23.70 per cent in 2018-19 after some upward and downward fluctuations.
- Administrative services Expenditure
Administrative services are necessary to maintain peace, law and order. The administrative expenditure has also increased very rapidly. In 1981-82 the administrative expenditures were 1,825 crores which increased to 2,07,538 crore in the year 2018-19.
- Social services Expenditure
The social services expenditure also has increased over time in India. The government provides various types of social services to support developmental activities. With an increase in developmental works and population the social services expenditure has increase overtime.
- Urbanization and Infrastructure Development
India is still to urbanized so a major portion of expenditure goes to urbanization and development of basic infrastructure facilities. Government undertakes the development and construction of various social overheads to support economic activities.
- Inflation
This is also one of the reasons that increased public expenditure. Inflation is a rise in the general price level in the country. Inflation increases the cost of both new and existing projects.
- Indian Economic and Political System
The Indian economy is a mixed economy where there is the participation of both the public and private sectors. It increases the responsibility of the government. India is also a democratic country where social welfare is promoted. Therefore, it increases the expenditure by the government.
On the basis of the preceding study, it can be inferred that although the public expenditure in India is growing in the absolute term it is showing decreasing sign in terms of growth rate. This should also be noted that the central government is shifting their expenditure from development to non-development category. The share of revenue expenditure is more than the share of capital expenditure. These findings show that the Indian economy is gradually moving towards a laissez-faire economy.
Download the full document in PDF format here.
5. Bibliography
Theory of public finance (various modules). epgpathshala
Public expenditure: theories and growth. egyankosh. Unit 10.
Singh, R. (2018). Indian Economy. McGraw Hill Education (India) Private Limited Chennai. 10th edition
Economic survey of India 2018-19

Author:
Alok Aditya
Department of Economic Studies and Policy
Central University of South Bihar
Pingback: Trends and Pattern of Non-tax Revenue in India | Easily Economics